
Teaching and research

There are a number of mechanisms available for educators to track progress and engagement within a course. These tools can be helpful when reviewing course content and reflecting on its effectiveness in student learning. These tools can also help educators understand how online students are progressing through a course, and can help inform approaches to re-engage and support students who might be at-risk of not passing or disengaging with a course.
The following resource outlines the Course Analytics tool for Canvas course engagement data and Panopto for video content engagement data, it will also provide guidance on analytics provided through Leganto the Course Reading platform.
It is important to note, that like any quantitative data, it does not provide the full picture of how a student is progressing in a course but is another tool in the educator toolkit.
Course Analytics - Canvas
New Analytics can track student progress and participation and communicate with students who may be falling behind.
Course Analytics can track student progress and participation and communicate with students who may be falling behind.
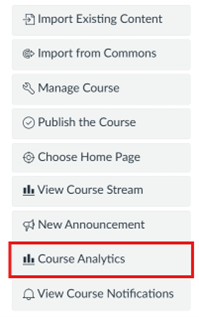
- Access Course Analytics from your Canvas course homepage.
- Course Analytics is organised into four distinct categories, presented as tabs, these are:
- Course Mark - allows you to track how students are performing in graded assignments and quizzes.
- Weekly Online Activity - allows you to track how students are engaging with your course content.
- Students - allows you to see how specific students are faring across your course in general.
- Reports - allows you to generate custom .csv files which you can filter in excel
- Although the tabs have their own specific features, there are a number that are common:
- Ability to filter your view and adjust the graphs.
- Ability to message (communicate with) students according to criteria.
- Ability to download a copy of data in .csv format.
- Ability to change layout of graph.
There are Canvas guides to assist you in using New Analytics in your course to help track student progression.
Keep in mind...
- Data is refreshed every 40 hours. If sending communication to students through New Analytics, be mindful to account for delays with data to prevent confusion.
- The Canvas BluePrint pages and 'Need Help?' menu item are not accurately reflected in views through New Analytics. Please disregard these pages.
- Page views are not an absolute but an approximation. Use only as an approximation to student activity. The data is most valuable when seeking to understand if activity did occur, and as a means of comparison.
- Students who are enrolled in multiple sections in a course will generate an entry for each section. This enables filtered data to reflect sections in a course.
- Course Activity reports cannot go back more than 27 days.
Panopto Analytics
Find your Panopto Statistics
To view the statistics for a particular session or a larger folder, find the 'Stats' button. For Session-level statistics this appears if you mouse over a particular video or session.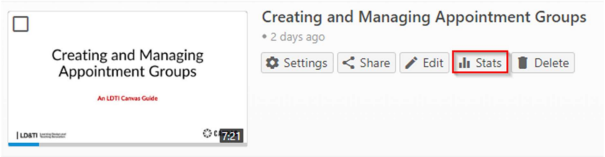
For folder-level statistics the button appears as an unlabelled set of columns beside the settings cog.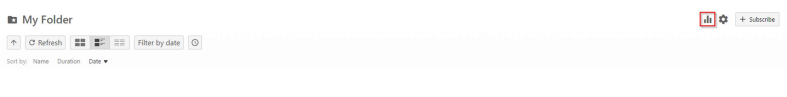
Viewing your Panopto Statistics
Panopto statistics can be viewed at different levels. The Session-level and Folder-level are most useful
Folder-Level Statistics
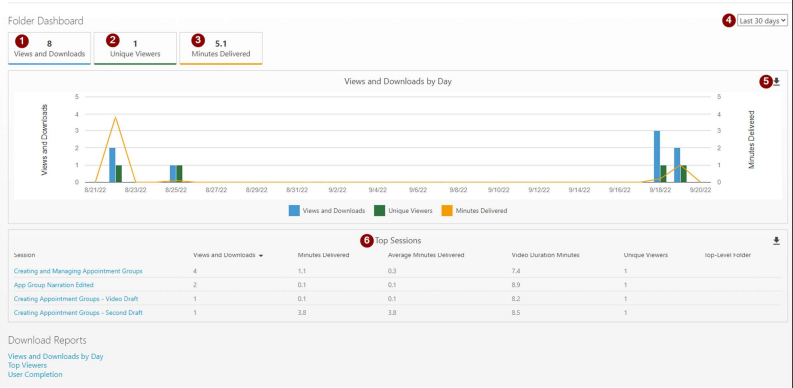
- Total number of views and downloads for the folder across the given timeframe.
- Number of unique views for the folder across the given timeframe.
- Total amount of minutes delivered. If a video is downloaded, the entire duration of the video will be added to this amount.
- Adjust the timespan of the graph. Default is 30 days but this can be adjusted to a variety of ranges.
- You can download various delections of data. Click the download icon or select the report from 'Download Reports'.
- Displays your top videos in the folder.
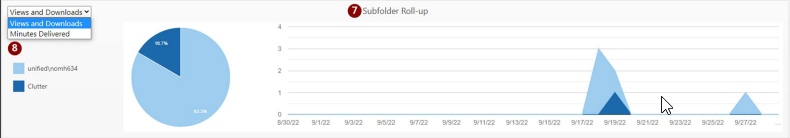
- Folders within a folder will have an additional panel of information that divides statistics by subfolder.
- The ability to change the data from views and downloads to minutes delivered.
Session-level statistics
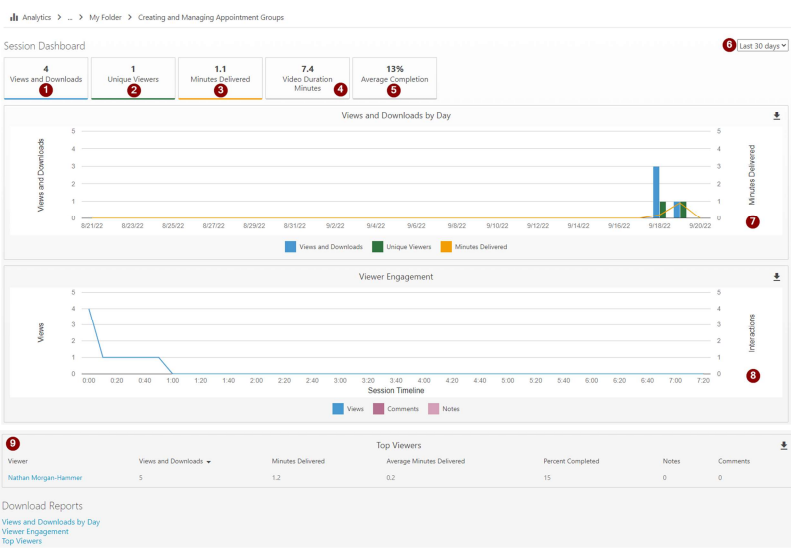
- Total number of views and downloads for the folder across the given timeframe.
- Number of unique views for the folder across the given timeframe.
- Total amount of minutes delivered. If a video is downloaded, the entire duration of the video will be added to this amount.
- Shows the duration of the video.
- Average completion rate of the video (how often it is watched to the end).
- Displays your top videos in the folder.
- Folders within a folder will have an additional panel of information that divides statistics by subfolder.
- Details viewer engagement by type.
- Top viewers by account with attendant data.
Course Reading Analytics
The Course Reading List is supported through the Leganto platform. There are course level analytics available to teaching staff to understand high level student engagement with the resources on the reading list. These analytics include active students (students who engaged with an item in any way), students who viewed the full text, students who marked as done and number of loans (if applicable).
Find out more about the Course Reading List Analytics here or watch a video that details how to monitor student usage.
Please contact your Teaching Liaison Librarian if you would like further information about course readings analytics.
The University of Newcastle acknowledges the traditional custodians of the lands within our footprint areas: Awabakal, Darkinjung, Biripai, Worimi, Wonnarua, and Eora Nations. We also pay respect to the wisdom of our Elders past and present.