2024 State results and rankings
National Final 2024 - Results
Rank | Score | School name |
|---|---|---|
1 | 1301.52 | Smith’s Hill High School |
2 | 1247.22 | James Ruse Agricultural High School |
3 | 1206.67 | Christ Church Grammar School |
4 | 1203.06 | Urrbrae Agricultural High School |
5 | 1173.29 | The Cathedral School of St Anne & St James |
6 | 1169.65 | Geelong Grammar School |
7 | 1121.47 | Calvin Christian School |
8 | 981.02 | Marist College Emerald |
National Final Qualifiers 2024
Congratulations to the schools who qualified for the 2024 National Final!
| State / zone | School | Regional score | Regional event | State final? |
|---|---|---|---|---|
| NT | St. Philip's College *unable to attend | 1396.66 | Alice Springs | N |
| TAS | Calvin Christian School | 1328.14 | Hobart | Y |
| VIC | Geelong Grammar School | 1311.99 | Geelong | Y |
| QLD | Marist College Emerald | 1415.00 | Emerald | N |
| NSW / ACT | Smith's Hill High School | 1508.31 | Illawarra and SE | Y |
| WA | Christ Church Grammar School | 1443.30 | Perth | N |
| SA | Urrbrae Agricultural High School | 1426.16 | Adelaide South | Y |
| Wildcard* | The Cathedral School of St Anne & St James | 1412.07 | Townsville | N |
| NSW** | James Ruse Agricultural High School | 1467.45 | Sydney Olympic Park | Y |
*The wildcard goes to the overall winner of the Townsville competition
**As St Philips College is unable to attend, this position is given to the next highest scoring school who placed first at a state final.
2024 Scores by State
Tasmania held a State Final this year, where the 8 qualifying schools competed for a spot in the National Final. The results from the state final are below. The highest scoring school qualifies for the National Final.
| Rank | Score | School |
|---|---|---|
| 1 | 1328.142 | Calvin Christian School |
| 2 | 1221.245 | Launceston Christian School |
| 3 | 1215.046 | Riverside High School |
| 4 | 1213.345 | Taroona High School |
| 5 | 1211.905 | The Friends' School |
| 6 | 1109.713 | Newstead Christian School/John Calvin School |
| 7 | 1088.009 | Leighland Christian School |
| 8 | 1080.911 | Southern Christian College |
Tasmania Statistics - who was involved in 2024?
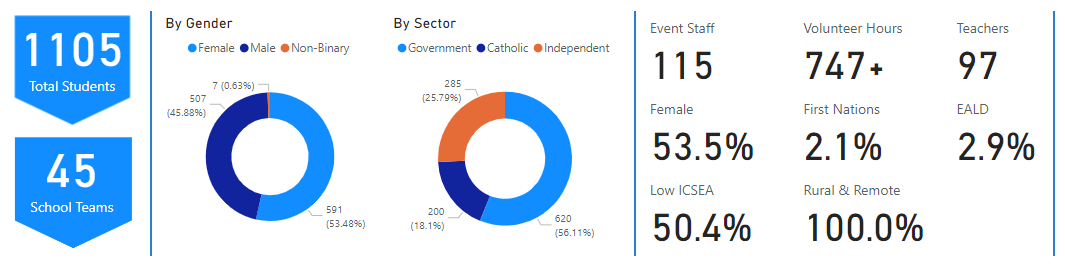
The image shows that 1105 students were involved in Science and Engineering Challenge events in Western Australia, including 45 school teams, 115 event staff and 97 teachers. Over 747 volunteer hours supported the events, and the participants included 53.5% female, 2.1% First Nations, 2.9% EALD, 50.4% Low ICSEA and 100% rural and remote locations.
Western Australia did not hold a state final this year. The table below shows the first-placed school for each event day in Western Australia. The highest scoring first-placed team qualifies for the National Final.
| Rank | Score | School |
|---|---|---|
| 1 | 1443.305 | Christ Church Grammar School |
| 2 | 1443.189 | Newman College |
| 3 | 1386.247 | Lake Joondalup Baptist College |
| 4 | 1343.838 | Churchlands Senior High School |
| 5 | 1292.685 | Fremantle College |
| 6 | 1288.852 | Our Lady of Mercy College |
| 7 | 1287.012 | Australind Senior High School |
| 8 | 1263.598 | Margaret River Senior High School |
Western Australian Statistics - who was involved in 2024?
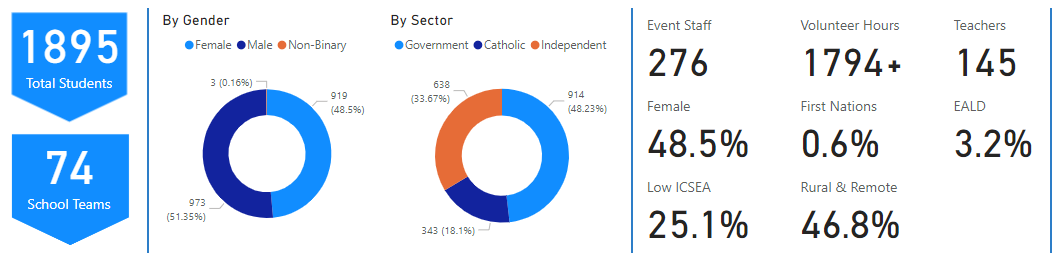
The image shows that 1895 students were involved in Science and Engineering Challenge events in Western Australia, including 74 school teams, 276 event staff and 145 teachers. Over 1794 volunteer hours supported the events, and the participants included 48.5% female, 0.6% First Nations, 3.2% EALD, 25.1% Low ICSEA and 46.8% rural and remote locations.
Queensland did not hold a state final this year. The table below shows the first-placed school for each event day in Queensland. The highest scoring first-placed team qualifies for the National Final.
| Rank | Score | School | Regional Event |
|---|---|---|---|
1 | 1415.25 | Marist College Emerald | Emerald |
2 | 1412.07 | The Cathedral School of St Anne & St James | Townsville |
3 | 1409.59 | Benowa State High School | Gold Coast |
4 | 1402.36 | Toowoomba Christian College | Darling Downs |
5 | 1392.33 | St Mary's Catholic College, Maryborough | Fraser Coast |
6 | 1384.75 | Brisbane Boys' College | Brisbane |
7 | 1375.18 | Brisbane State High School | Brisbane |
8 | 1372.54 | St John's Anglican College | Brisbane North |
9 | 1366.91 | Downlands College | Darling Downs |
10 | 1349.53 | St Augustine's College | Cairns |
11 | 1342.81 | Hillcrest Christian College | Gold Coast |
12 | 1340.96 | Queensland Academy for Science Mathematics and Technology | Brisbane North |
13 | 1337.87 | Ignatius Park College | Townsville |
14 | 1333.94 | Redlands College | Brisbane |
15 | 1331.75 | Whitsunday Anglican School | Mackay |
16 | 1331.35 | Mount Gravatt State High School | Brisbane north |
17 | 1330.89 | Flagstone State Community College | Brisbane South |
18 | 1327.25 | Warwick State High School | Darling Downs |
19 | 1303.98 | Coolum Beach Christian College | Gympie |
20 | 1300.36 | Pacific Pine State High School | Brisbane South |
21 | 1291.46 | Bundaberg State High School | Bundaberg |
22 | 1261.56 | The Cathedral College, Rockhampton | Rockhampton |
23 | 1246.66 | Fairholme College | Darling Downs |
24 | 1233.36 | Mt St Michael's College | Brisbane |
Queensland Statistics - who was involved in 2024?
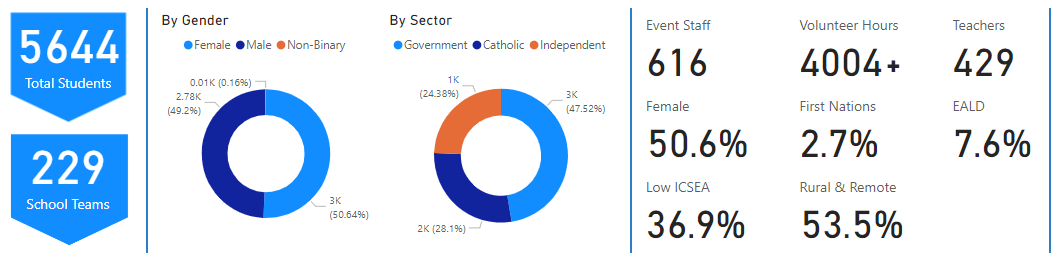
The image shows that 5644 students were involved in Science and Engineering Challenge events in Queensland, including 229 school teams, 616 event staff and 429 teachers. Over 4004 volunteer hours supported the events, and the participants included 50.6% female, 2.7% First Nations, 7.6% EALD, 39.9% Low ICSEA and 53.5% rural and remote locations.
The Northern Territory did not hold a state final this year. The table below shows the results from the Alice Springs event. The first-placed team qualifies for the National Final.
| Rank | Score | School |
|---|---|---|
| 1 | 1396.659 | St Philip's College |
| 2 | 1320.463 | Centralian Senior School |
| 3 | 1162.388 | Centralian Middle School |
| 4 | 515.9562 | Home Schooling Network |
| 5 | 457.1841 | Yirara College |
| 6 | 355.7607 | Our Lady of the Sacred Heart Catholic College |
Northern Territory Statistics - who was involved in 2024?
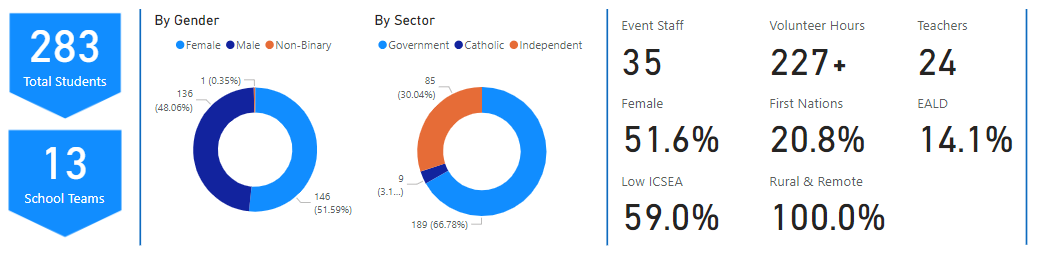
The image shows that 283 students were involved in Science and Engineering Challenge events in the Northern Territory, including 13 school teams, 35 event staff and 24 teachers. Over 227 volunteer hours supported the events, and the participants included 51.6% female, 20.8% First Nations, 14.1% EALD, 59% Low ICSEA and 100% rural and remote locations.
New South Wales held three days of state finals. The results from each day and the overall rankings are shown below. The highest scoring school from the state final qualifies for the National Final.
New South Wales statistics - who was involved in 2024?
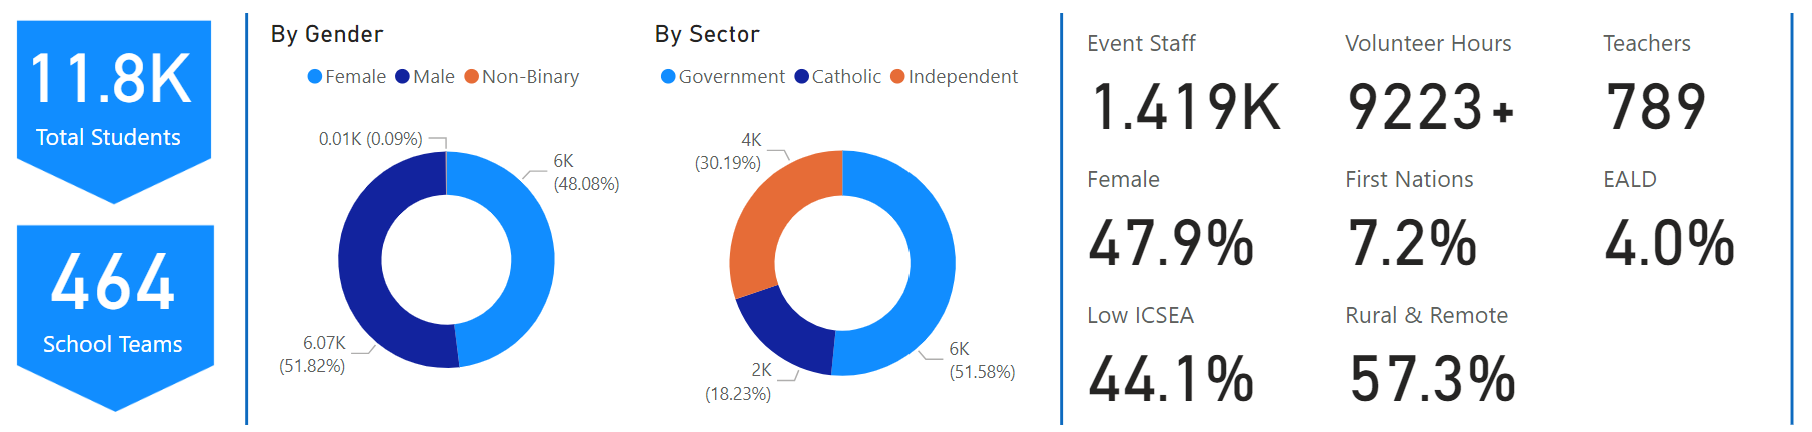
The image shows that 11766 students were involved in Science and Engineering Challenge events in New South Wales, including 464 school teams, 1419 event staff and 789 teachers. Over 9223 volunteer hours supported the events, and the participants included 47.9% female, 7.2% First Nations, 4.0% EALD, 44.1% Low ICSEA and 57.3% Rural and Remote locations.
NSW State final results
Day 1 Tuesday
Rank | Score | School | Regional Event |
|---|---|---|---|
1 | 1467.45 | James Ruse Agricultural High School | Sydney Olympic Park |
2 | 1346.47 | St Columba Anglican School | Kempsey |
3 | 1342.85 | Emmaus Christian School | ACT |
4 | 1332.38 | Penrith Selective High School | Kingswood |
5 | 1256.65 | Newcastle High School | Newcastle |
6 | 1167.44 | St Joseph's Catholic College | Upper Hunter |
7 | 1063.68 | Mudgee High School | Dubbo |
8 | 1037.91 | Narrabri High School | North West |
Day 2 Wednesday
Rank | Score | School | Regional Event |
|---|---|---|---|
1 | 1351.65 | Gosford High School | Central Coast |
2 | 1298.69 | All Saints College St. Peter's Campus | Newcastle |
3 | 1255.85 | Wenona School | Macarthur |
4 | 1243.72 | Newington College | Sydney Olympic Park |
5 | 1183.58 | The Henry Lawson High School | South West Slopes |
6 | 1113.94 | Camden Haven High School | Kempsey |
7 | 1032.88 | Northholm Grammar School | Sydney Olympic Park |
8 | 980.79 | Cobar High School | Outback |
Day 3 Thursday
Rank | Score | School | Regional Event |
|---|---|---|---|
1 | 1508.31 | Smith's Hill High School | Illawarra and SE |
2 | 1338.20 | Illawarra Christian School | Illawarra and SE |
3 | 1319.03 | Kirrawee High School | Lucas Heights |
4 | 1261.24 | Farrer Memorial Agricultural High School | Tamworth |
5 | 1248.40 | Chevalier College | Southern Highlands |
6 | 1208.25 | Newcastle Grammar School | Newcastle |
7 | 1114.41 | St Dominic's College | Kingswood |
Overall State Rankings
Rank | Score | School | Regional Event |
|---|---|---|---|
1 | 1508.31 | Smith's Hill High School | Illawarra and SE |
2 | 1467.45 | James Ruse Agricultural High School | Sydney Olympic Park |
3 | 1351.65 | Gosford High School | Central Coast |
4 | 1346.47 | St Columba Anglican School | Kempsey |
5 | 1342.85 | Emmaus Christian School | ACT |
6 | 1338.2 | Illawarra Christian School | Illawarra and SE |
7 | 1332.38 | Penrith Selective High School | Kingswood |
8 | 1319.03 | Kirrawee High School | Lucas Heights |
9 | 1298.69 | All Saints College St. Peter's Campus | Newcastle |
10 | 1261.24 | Farrer Memorial Agricultural High School | Tamworth |
11 | 1256.65 | Newcastle High School | Newcastle |
12 | 1255.85 | Wenona School | Macarthur |
13 | 1248.4 | Chevalier College | Southern Highlands |
14 | 1243.72 | Newington College | Sydney Olympic Park |
15 | 1208.25 | Newcastle Grammar School | Newcastle |
16 | 1183.58 | The Henry Lawson High School | South West Slopes |
17 | 1167.44 | St Joseph's Catholic College | Upper Hunter |
18 | 1114.41 | St Dominic's College | Kingswood |
19 | 1113.94 | Camden Haven High School | Kempsey |
20 | 1063.68 | Mudgee High School | Dubbo |
21 | 1037.91 | Narrabri High School | North West |
22 | 1032.88 | Northholm Grammar School | Sydney Olympic Park |
23 | 980.79 | Cobar High School | Outback |
South Australia held a State Final this year, where the qualifying schools competed for a spot in the National Final. The results from the state final are below. The highest scoring school qualifies for the National Final.
Rank | Score | School | Regional Event |
|---|---|---|---|
1 | 1426.16 | Urrbrae Agricultural High School | Adelaide South |
2 | 1390.86 | Pembroke School | Adelaide South |
3 | 1373.59 | Heathfield High School | Adelaide South |
4 | 1295.07 | Cardijn College | Adelaide South |
5 | 1192.16 | Waikerie High School | Riverland |
6 | 1165.55 | Heritage College Adelaide | Adelaide South |
7 | 1121.36 | Loxton High School | Riverland |
South Australian statistics - who was involved in 2024?
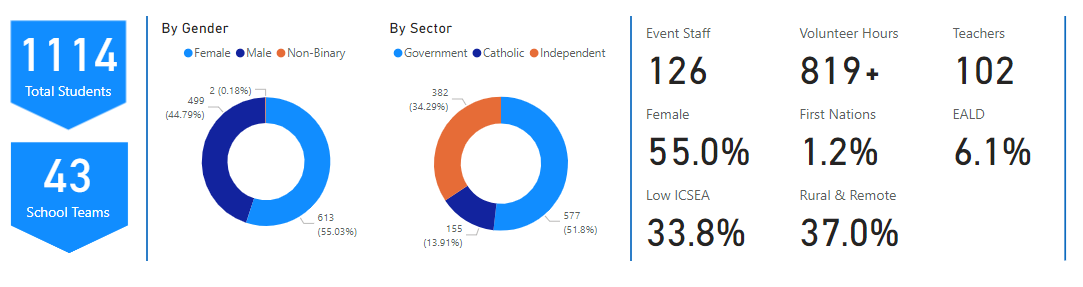
The image shows that 1114 students were involved in Science and Engineering Challenge events in South Australia, including 43 school teams, 126 event staff and 102 teachers. Over 819 volunteer hours supported the events, and the participants included 55% female, 1.2% First Nations, 6.1% EALD, 33.8% Low ICSEA and 37% Rural and Remote locations.
Victoria held a State Final this year, where the 8 qualifying schools competed for a spot in the National Final. The results from the state final are below. The highest scoring school qualifies for the National Final.
Rank | Score | School | Regional Event |
|---|---|---|---|
1 | 1311.99 | Geelong Grammar School | Geelong |
2 | 1251.74 | Bendigo South East College | Bendigo |
3 | 1247.03 | Ballarat Grammar | Ballarat |
4 | 1229.09 | Auburn High School | Burwood |
5 | 1221.29 | Koonung Secondary College | Burwood |
6 | 1147.68 | Christian College Geelong, Waurn Ponds | Geelong |
7 | 1088.49 | King's College | Great South Coast (Warrnambool) |
8 | 918.87 | Kaniva College and Goroke P-12 College | Wimmera (Horsham) |
Victorian statistics - who was involved in 2024?
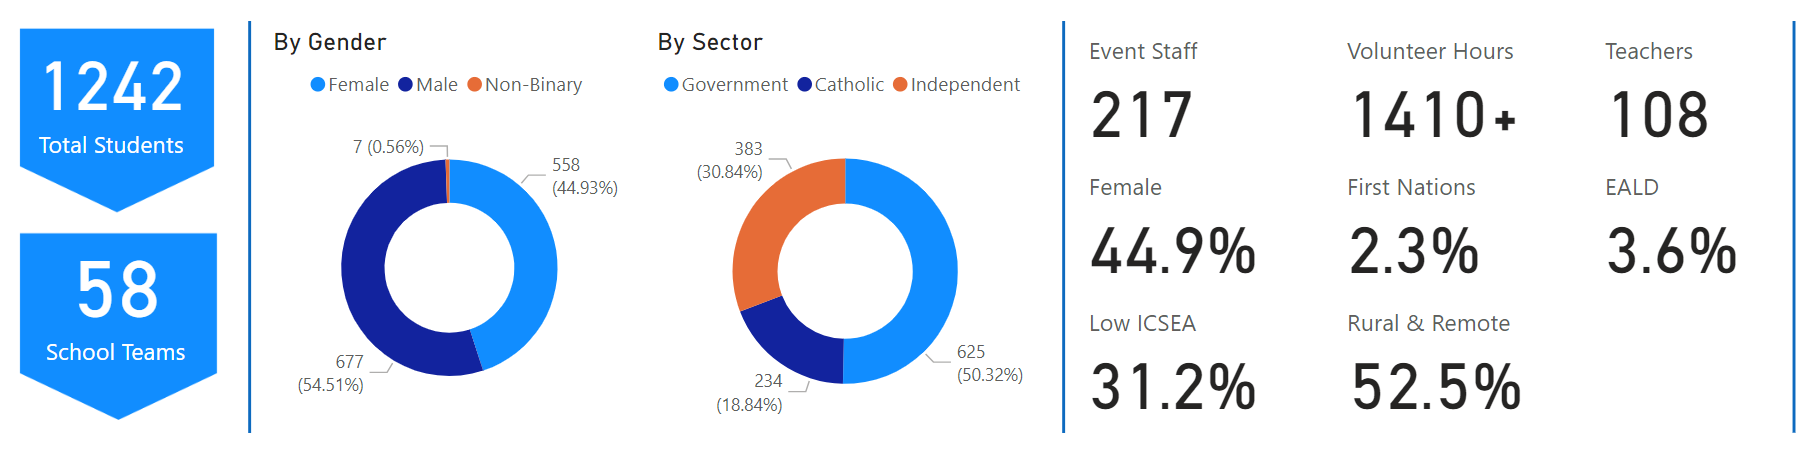
The image shows that 1242 students were involved in Science and Engineering Challenge events in Victoria, including 58 school teams, 217 event staff and 108 teachers. Over 1410 volunteer hours supported the events, and the participants included 44.9% female, 2.3% First Nations, 3.6% EALD, 31.2% Low ICSEA and 52.5% Rural and Remote locations.
The University of Newcastle acknowledges the traditional custodians of the lands within our footprint areas: Awabakal, Darkinjung, Biripai, Worimi, Wonnarua, and Eora Nations. We also pay respect to the wisdom of our Elders past and present.