Data Visualisation With Google Fusion Tables
 Data Visualisation With Google Fusion Tables
Have you got data in different forms that you want to compare directly? Do you want to show your data on a map to improve your research message?
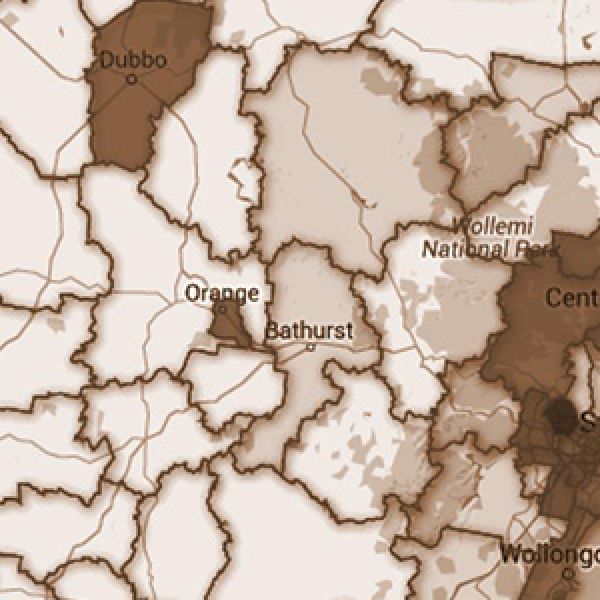
This workshop is an introduction to data visualisation techniques using hands-on activities in Google Fusion Tables. The course is ideal for participants who work with large data sets and want to convey their research outcomes clearly and persuasively in a visual manner. By merging geospatial data and crime statistics to create a heat map, participants will gain skills in visualisation that they can apply to their research.
You’ll learn how to:
- Import data into Google Fusion Tables
- Merge multiple data sets in Fusion Tables
- Create interactive heatmaps on a Google Map
- Vary the way the visualisation is presented in Fusion Tables
Download Course Outline.
Register here.
Event Information
- Date: This event was held on Monday 4 June 2018
- Location: CT306
The University of Newcastle acknowledges the traditional custodians of the lands within our footprint areas: Awabakal, Darkinjung, Biripai, Worimi, Wonnarua, and Eora Nations. We also pay respect to the wisdom of our Elders past and present.