
Research services

Grants and funding
We help our researchers identify, apply for and manage their research grants.

Human research ethics
Research that is conducted with or about people, their data or tissues must receive human ethics approval.

Animals in Research and Teaching
Any research or teaching activity that involves the use of animals must receive approval from our independent animal ethics committee.

Research integrity
We help ensure all research carried out at the University of Newcastle complies with university policies, state and federal legislation, and best-practice codes.
Research performance
We coordinate institutional research reporting and provide insights that can help teams better understand and improve their research performance.

Research safety
Research activities can come with health and safety risks. We help our research teams mitigate those risks to support a safe work environment for all.

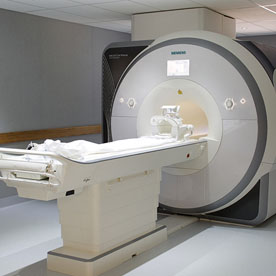
Central Analytical Facilities
We manage a suite of specialised equipment that helps our interdisciplinary research teams deliver new discoveries.
The University of Newcastle acknowledges the traditional custodians of the lands within our footprint areas: Awabakal, Darkinjung, Biripai, Worimi, Wonnarua, and Eora Nations. We also pay respect to the wisdom of our Elders past and present.