
Statistics courses
- STAT1020: Statistical Reasoning and Literacy
- STAT1060: Business Decision Making
- STAT1070: Statistics for the Sciences
- STAT1300: Fundamentals of Statistics
- STAT2000: Applied Statistics and Research Methods
- STAT2020: Predictive Analytics
- STAT2300: Statistical Inference
- STAT3030: Generalised Linear Models
- STAT3040: Forecasting with Linear Time Series Models
- STAT3100: Systems Thinking for an Integrated Workforce
- STAT3800: Deterministic and Stochastic Optimisation
STAT1020: Statistical Reasoning and Literacy
2021 Offerings: Semester 1, Semester 2
Want to know more about how data builds knowledge? This course will help you understand the basics
of sampling, research design and statistical methods. We focus on understanding statistical results from
scientific papers, without going through the process of carrying out statistical tests themselves. We cover a
wide variety of statistical methods and graphical data presentations.
STAT1060: Business Decision Making
2021 Offerings: Semester 1, Semester 2
STAT1060 is an introductory course in qualitative and quantitative methods which underpins effective
business decision making and is taught within a business context. The course develops a student’s ability
to incorporate statistical thinking and to take account of variation in the real world during processes of
establishing project initiatives, defining objectives, data collection, data presentation, data analysis, reporting
and decision making.
Presenting data, Descriptive and Inferential Statistics, Data types, Hypothesis testing, Sampling and
Assessment of Risk, Confidence intervals, Correlation, and regression are some of the topics covered.
This is an excellent course to build some basic foundations in statistics.
Some excellent courses to follow on from STAT1060 include STAT2000, STAT1300, STAT3100, STAT3040
and STAT3800. Such a set of courses would likely help graduates stand out in job interviews as the associated
skills are highly sought after in a business world where there is an abundance of data, more than ever before,
and with few people with suitable qualifications and skills to analyse such data. Students who are interested
in a set of courses to enable accreditation as a statistician should consult staff from the statistics discipline to
examine courses that would enable this.
STAT1070: Statistics for the Sciences
2021 Offerings: Summer 2, Semester 1, Semester 2
The scientific method is the bedrock of all sciences. Did you know that statistics can be thought of as a formalisation of the scientific method? That’s why STAT1070 continues to be one of the largest courses taught at the University - statistics is vital to understanding the world around us! If you are curious about the world and how scientific knowledge is developed, then STAT1070 is the course for you!
In STAT1070, you will gain key introductory skills in applied statistics and data analysis, including describing data sets with graphs and numerical summaries, understanding basics of probability, learning how to obtain a good sample, and applying a number of techniques to draw conclusions about populations of interest based on these samples!
STAT1070 is resourced with exciting, up-to-date materials, an experienced and acclaimed teaching and learning support staff, and numerous resources for help.
STAT1100: Data Wrangling and Visualisation
2021 Offerings: Semester 1
Do you need to extract and communicate information from data? Let’s face it, we all do, and having the
fundamental skills to do so is becoming ever more important. Out in the wild, data is often not in an
immediately friendly or usable format. Grrr! It needs to be corralled, taken charge of, and placated. It
requires wrangling: management, manipulation, and error-checking. Meow! Once we have our data under
control, we need to give it a good look over before we then show it off, and while a picture might be worth a
thousand words, the right visualisation is priceless. Ka-ching! Visualisation is invaluable whether it be for
error-checking or finding and communicating key information.
In this course you will learn basic techniques from statistics and data science for wrangling and visualising
data while developing valuable coding skills using the Python language, arguably the most popular and
preferred language for, well, pretty much everything! Seriously! No prior programming experience is necessary:
batteries are included
STAT1300: Fundamentals of Statistics
2021 Offerings: Semester 2
Compulsory Course in:
- Bachelor of Mathematics
- Bachelor of Science: Major in Statistics
- Bachelor of Science: Major in Psychology
Are you curious about the mathematics between statistical procedures? Are you interested in learning how to estimate chances associated with various real-world phenomena such as the number of hurricanes that form in a tropical season, the amount of time you have to wait at the post office, or the gestation periods of elephants? Are you interested in developing statistical coding skills by learning the most popular R software language, R? Then STAT1300 is the course for you!
STAT1300 is a well-received and well-resourced course in which you will build valuable quantitative skill sets that will put you on a great path to employability. Plus, there is an optional contest you can choose to compete in with a prize! It assumes mathematical background information of single-variable calculus, as covered in MATH1110. If you are interested in STAT1300, please contact Ian Renner at Ian.Renner@newcastle.edu.au for any questions.
As an example, the below graph is an exploration of the Central Limit Theorem when applied to the gamma distribution. On the left, we see a graph of the probability density function. In the middle, we see that as the sample size increases, there is increasing evidence (as shown by decreasing p-values) that random data drawn from the gamma distribution is not normally distributed. On the right, we see that as the sample size increases, evidence that sample means generated from random samples of the gamma distribution disappears. In STAT1300, we will use R in this way to illustrate many fundamental results of statistics via simulation.
If you’d like a bit more of a flavour of how we can use R for statistical analysis, click on this link to see one way to model Atlantic tropical systems.
STAT2000: Applied Statistics and Research Methods
2021 Offerings: Semester 1
This is an applied Statistics course which will meet the needs of practitioners in a wide range of science-related disciplines as well as budding statisticians. STAT2000 builds upon the basic techniques taught in the STAT1070 course. Practical data analysis is experienced including how to design appropriate research studies and collect data.
Assumed knowledge
At minimum students should have completed an introductory statistics course such as STAT1070 or STAT2010.
STAT2020: Predictive Analytics
2021 Offerings: Semester 2
The world is awash in data and there is a huge demand for people with the skills and knowledge to turn data into actionable insights. STAT2020 covers the foundations of predictive analytics, statistical learning, statistical computing, descriptive and predictive modelling, and exploratory data analysis. Students will develop an understanding of the field of machine learning from a statistical perspective.
Assumed knowledge
At minimum students should have completed an introductory statistics course such as STAT1070 or STAT2010. Ideally, students will be better prepared to undertake STAT2020 if they also: (a) have had some previous exposure to computer programming and statistical software; and (b) have background in basic calculus, probability and notions of elementary matrix algebra.
STAT2300: Statistical Inference
2021 Offerings: Semester 2
Why do we use particular statistical techniques, and how do they work? This course covers the theory behind both standard and computationally intensive techniques for investigating and modelling data (estimation and hypothesis testing).
Assumed knowledge
Students should have completed STAT1300 prior to undertaking this course.
STAT3030: Generalised Linear Models
2021 Offerings: Semester 2
Most of the statistical techniques covered in courses such as Stat1070, Statistics for the Sciences and Stat2000, Applied Statistics, are members of the class of Generalised Linear Models. This course brings together all these statistical analysis methods and explores both the underlying theory and the practice of data modelling for both continuous and discrete response distributions.
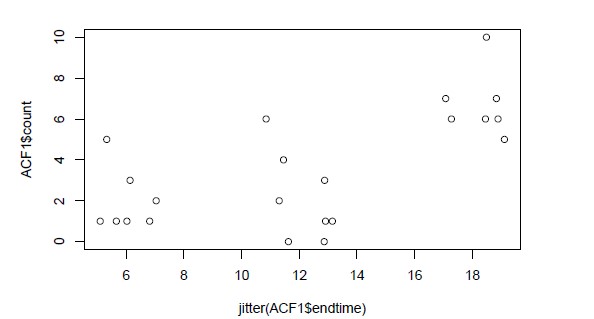
You will learn analysis methods such as poisson regression — this example has counts of “aberrant crypt foci”
(ACF) —- a precursor to bowel cancer, in a lab study in rats.
There are just 2 variables in this data extract, a count of the foci in the bowels of the study animals and the
time in weeks from exposure to the possible carcinogen. The analysis shows an increase in the count of ACF
over time.
library(DAAG)
## Warning: package 'DAAG' was built under R version 4.0.3
## Loading required package: lattice
data(ACF1)
plot(jitter(ACF1$endtime), ACF1$count)
ac1 <- glm(count~endtime,family=poisson,data=ACF1)
summary(ac1)
##
## Call:
6
## glm(formula = count ~ endtime, family = poisson, data = ACF1)
##
## Deviance Residuals:
## Min 1Q Median 3Q Max
## -2.46204 -0.47851 -0.07943 0.38159 2.26332
##
## Coefficients:
## Estimate Std. Error z value Pr(>|z|)
## (Intercept) -0.32152 0.40046 -0.803 0.422
## endtime 0.11920 0.02642 4.511 6.44e-06 ***
## ---
## Signif. codes: 0 '***' 0.001 '**' 0.01 '*' 0.05 '.' 0.1 ' ' 1
##
## (Dispersion parameter for poisson family taken to be 1)
##
## Null deviance: 51.105 on 21 degrees of freedom
## Residual deviance: 28.369 on 20 degrees of freedom
## AIC: 92.209
##
## Number of Fisher Scoring iterations: 5
STAT3100: Systems Thinking for an Integrated Workforce
2021 Offerings: Semester 2
The field of Statistics supports performance assessment and improvement. Statistician W.E. Deming led the world in this regard in what became known as Total Quality Management.
Through a quality improvement and data analytics lens, this practical course develops the student’s ability to leverage workplace data & synergies, analyse & improve organisational systems, assume collaborative leadership roles & realise quality processes & outcomes.
Assumed knowledge
10 unit 1000 level Statistics course and at least 40 units at 2000 level from any degree program
About the coordinator
Professor Peter Howley has over 3 decades experience collaborating in quality and performance improvement across industry, health, education, management and other fields; working with organisations including Taiwan and Australian Health, Government, and assuming International Advisory Board and other leadership roles.
STAT3040: Forecasting with Linear Time Series Models
2021 Offering: Semester 1
Assumed knowledge
STAT1070 or STAT1300 (formerly STAT2010), or STAT2110
A time series is a collection of random variables indexed according to the order in which they are observed in time. For instance, Newcastle annual total rainfall, NSW monthly average temperature, Woolworths weekly total earnings, and New York daily stock exchange. The main objective of time series analysis is to develop a statistical model to forecast the future behaviour of the system.
At a high level, the main approaches for this include the ones based on considering the data in its original time domain and those arising from analysing the data in the corresponding frequency domain. More specifically, the former approach focuses on modelling some future value of a time series as a parametric function of the current and past values by studying the correlation between adjacent points in time. The latter framework, however, assumes the primary characteristics of interest in time series analysis relate to periodic or systematic sinusoidal variations. Although the two approaches may produce similar outcomes for many cases, the comparative performance is better done in the time domain which is the main focus of this course.
The statistical package/language R will be used throughout the course. Although it is assumed that students have already been acquainted with the statistical software R in the previous courses, we start teaching R in the computer labs from scratch with a focus on time series analysis.
The following figure was provided by a group of students as the outcome of their course project in 2019. This figure displays the monthly total number of arrivals to Australia. In this figure, the solid black plot is the actual training data used for modelling, the dashed black plot is the actual test data to check the accuracy of predictions, the solid red plot shows the predictions generated by the fitted statistical model, and the two dashed blue plots are the lower and upper 95% confidence bounds for predictions. It is well illustrated that the fitted model could forecast the monthly total number of arrivals from July 2018 to June 2019 with a high degree of accuracy.
STAT3800: Deterministic and Stochastic Optimisation
2021 Offerings: Semester 1
Assumed knowledge
(MATH1120 or MATH1220) and (STAT1070 or STAT1300 (formerly STAT2010), or STAT2110)
From analysing and optimising supply chains and queuing networks to cognitive science and controlling autonomous vehicles, stochastic systems have many applications. This course develops the student’s ability to understand and apply statistical modelling and analysis for optimising systems under uncertainty in practice.
Fundamental to industry and business, across scientific, financial, engineering and broader fields, the course focuses on methods for optimising stochastic systems, particularly where the dynamic of the system is governed by a Markov chain. Whilst in practice we frequently encounter systems whose parameters are uncertain, namely stochastic systems, initial consideration is also provided for optimisation methods and their applications in statistical inference with big data when all system or model parameters are known, namely deterministic models.
Here are some practical applications of optimisation:
- Inventory control. In the light of fluctuating prices, how much raw material should be purchased to meet demands, such that the expected total cost (purchase, stockholding, shortage) over a finite time horizon is minimised?
- Power generation. How much hydroelectric power should be generated to supplement thermal power, where excess power may also be sold, such that the expected productions costs, net of sales income, over a finite time horizon is minimised?
- Maintenance policy. To decide at what age a vehicle becomes too expensive to repair and should be replaced, such that long-run cost per unit time is minimised?
- Healthcare system. To decide how many patients to admit at specified times, taking into account possible overflows and under utilisation of capacity, such that long-run bed occupancy level is maximised?
- Fishery management. What proportion of a given salmon population should be caught, reserving some for spawning the next season, such that infinite horizon discounted total catch is maximised?
The University of Newcastle acknowledges the traditional custodians of the lands within our footprint areas: Awabakal, Darkinjung, Biripai, Worimi, Wonnarua, and Eora Nations. We also pay respect to the wisdom of our Elders past and present.