
Hunter Insight Dashboard
Economic Update - September 2026
The University of Newcastle’s Institute for Regional Futures’ Insight Dashboard tracks socio-economic conditions in the Hunter. The dashboard is based on the Hunter Research Foundation Centre’s databank, which has been collected over 60 years and is one of Australia’s longest-running and most extensive regional databanks.
This dashboard of economic updates is designed to give decision-makers in government, industry, and the community the latest data on the Hunter’s performance across key indicators. The dashboard draws upon national and regional data sources to deliver insights about the Hunter region. These updates are provided regularly throughout the year, in addition to the Hunter Insight Series.
The dashboard is a snapshot of just some of the total data collected by the Institute for Regional Futures. For more information, please contact irf@newcastle.edu.au.
International and national conditions
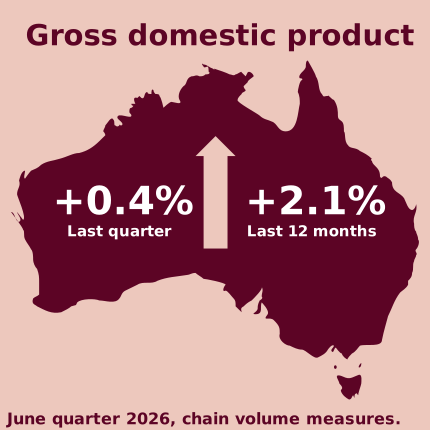
- National: Economic growth, measured through Gross Domestic Product, accelerated to +0.4% in the June quarter 2026 (up from +0.3% in the March quarter 2026), for a 12-month increase of +2.1%.
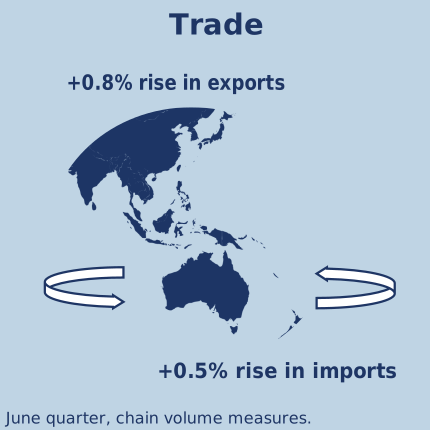
- Trade: Net trade added 0.1 percentage points to growth in the June quarter, as exports rose 0.8% and imports rose 0.5%. The terms of trade fell 1.6% over the quarter.
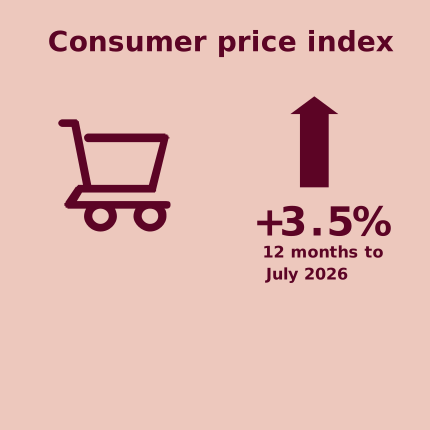
- Household: Price rises, as measured by the Consumer Price Index (CPI), have eased in each of the four months since March but remain above the Reserve Bank’s 2 to 3 per cent target band, with the most recent 12-month CPI at +3.5% (year to July 2026), down from a peak of 4.6% in March 2026.
Hunter conditions
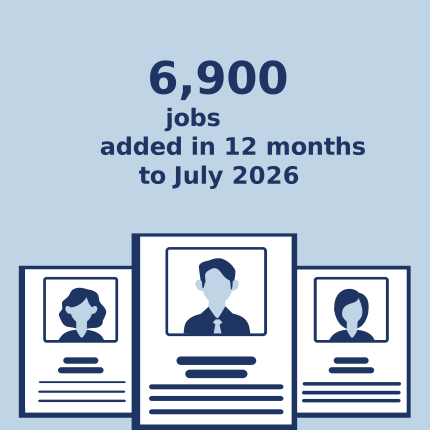
- Hunter labour market (employment): Employment in the Hunter has continued a modest upward trend, on three-month moving averages. The average is around 6,900 jobs higher than a year earlier (July 2026, about +1.9%) and about +2,200 higher than three months ago, reaching around 372,000. These are movements in a smoothed series, not counts of jobs created in a single month.
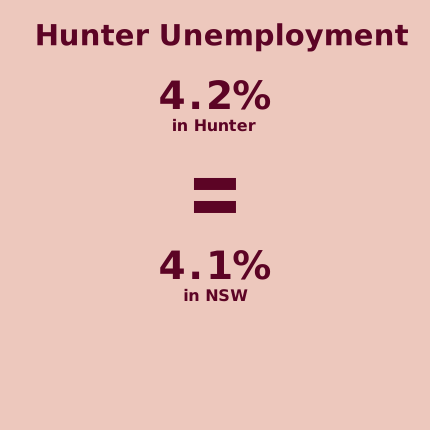
- Hunter labour market (unemployment): The unemployment rate in the Hunter is 4.2% (three-month moving average), unchanged from a year earlier and in line with the NSW rate of 4.1%, having eased back from a peak near 4.7% in May 2026. Youth unemployment in the Hunter is 9.7%, in line with the NSW rate of 9.7%.
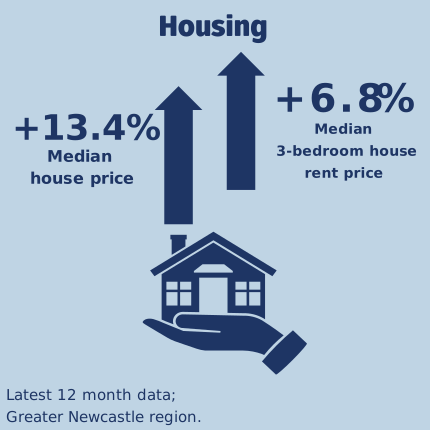
- Hunter housing market: DCJ data show dwelling sale prices across the Newcastle Statistical Subdivision (Cessnock, Lake Macquarie, Maitland, Newcastle and Port Stephens) rose +12.2% over the year to the March quarter 2026, to a median of $920,000. Median rent for a three-bedroom house was $670 a week in the June quarter 2026, +5.5% over the year. Sale-price data lag the rent data by a quarter.
Contents
National economy
Trends: National economic growth accelerated modestly in the latest quarter, though the through-the-year rate has continued to ease, at +2.1% to the June quarter 2026.
Latest: In the June quarter 2026, Australia’s GDP grew by +0.4%, picking up from a softer +0.3% in the March quarter 2026. With population still growing, the gain in aggregate output did not translate into higher output per person. Annual growth was +2.1% (chain volume measures), down from 2.5% in the year to the March quarter.
Download the data behind this chart (CSV) Data source: ABS Australian National Accounts: National Income, Expenditure and Product.
At the national level, Australian Bureau of Statistics (ABS) data shows a quarterly rise in Gross Domestic Product (GDP) of +0.4% for the June quarter 2026. This is a step up from the previous quarter’s rise of +0.3% and leaves the 12-month rate of growth at +2.1% (chain volume measures). The composition of growth differed from the previous quarter: net trade moved from a large detraction to a small positive contribution, private investment was flat after driving the March quarter, and household and government consumption accounted for most of the increase. On a per-capita basis, GDP was flat in the quarter (up 0.7% over the year).
Key themes from the ABS Australian National Accounts, June quarter 2026 release:
- Household consumption rose 0.4% in the quarter (1.8% through the year) and added 0.2 percentage points to growth. The household saving ratio edged up to 6.5%, from 6.4% in the previous quarter.
- Government final consumption rose 0.6% (2.0% through the year), adding 0.1 percentage points to growth.
- Private investment was flat in the quarter and made no contribution to growth. Machinery and equipment fell 6.6%, unwinding the 17.3% rise of the March quarter, while dwelling investment rose 1.6%.
- Net trade added 0.1 percentage points to growth, with exports up 0.8% and imports up 0.5%.
- Mining gross value added rose 1.3%, following a 2.0% fall in the March quarter. The ABS attributes the recovery in coal to a bounce back from earlier weather disruptions.
- The terms of trade fell 1.6% in the quarter and were 0.6% lower through the year.
See ABS for more info.
Download the data behind this chart (CSV) Data source: ABS Australian National Accounts: National Income, Expenditure and Product.
Business performance
The NAB Monthly Business Survey gives a read on business activity in NSW, and by extension regions like the Hunter. All figures quoted here are seasonally adjusted. To August 2026, the survey put business conditions in NSW at around 0 (compared with around -1 nationally), while business confidence was around -9 in NSW and around -8 nationally. The conditions index combines reported trading, profitability and employment, while confidence is more forward-looking and tends to move faster with global developments.
The pattern reported in the June update, of weak confidence alongside positive trading conditions, no longer holds. Conditions in NSW have trended down from around +11 in late 2025 to approximately zero, and the national reading has turned negative for the first time in six years, its lowest since August 2020. Confidence fell to around -31 in NSW in March 2026 following the outbreak of the Middle East conflict and recovered to near neutral by June, before falling sharply in July and edging up in August to remain weak at -9. NAB notes national confidence remains about 7 points below its pre-conflict February level and 13 points below its long-run average.
At an industry level, conditions fell in six of the eight industries surveyed, led by construction, mining and manufacturing. Confidence was steady or improved in most industries but fell across retail, construction and mining. In trend terms confidence is now negative in every industry, with transport and utilities among the weakest. Capacity utilisation eased to 82.5%, still above its long-run average.
Within the conditions index, profitability fell 10 points to -9 while employment held at +3. NAB notes this divergence is unlikely to be sustained, and that weaker employment outcomes would be expected to follow if profitability stays at these levels. NAB also identifies construction as an area to watch, given dwelling prices, construction costs and developer solvency.
Download the data behind this chart (CSV)
Data source: NAB Group Economics
Household spending and prices
The ABS Monthly Household Spending Indicator shows household spending continuing to grow, up around +7.0% in current prices over the year to July 2026. In NSW, spending was 6.4% higher over the same year, led by recreation and culture (+9.8%) and transport (+8.2%). Discretionary spending rose 6.9% against 5.5% for non-discretionary, and services 6.6% against 6.3% for goods. Food spending rose 6.2%, while alcohol and tobacco was the weakest category at +2.0%.
The consumer price index rose +3.5% over the year to July 2026. Inflation has turned since the previous update: the monthly indicator jumped from 3.7% in February to a peak of 4.6% in March 2026, then eased in each of the four months since (4.2%, 4.0%, 3.8% and +3.5% in July). It nonetheless remains above the Reserve Bank’s 2 to 3 per cent target band.
The spike and the subsequent easing are both largely a tradables story. Tradables inflation rose from 1.3% in February to 4.5% in March and was back to 1.7% by July, following automotive fuel, where the year-ended rate moved from -7.2% in February to +24.2% in March on the disruption to oil markets, and to -0.4% by July. Non-tradables inflation has changed little over the same period, at 5.0% in February, 4.6% in March and 4.4% in July, so domestic price pressure remains above the target band.
Download the data behind this chart (CSV)
Data source: ABS Consumer Price Index, Australia (monthly)
The ABS publishes specific price data on housing-related expenses to give better insight (at the national level) into the price movements of purchases, rents and other expenses. Over the year to July 2026, electricity rose 6.1% as state and federal rebates continued to unwind, new dwelling purchase 5.7%, gas and other household fuels 3.7%, and rents 3.6%.
Download the data behind this chart (CSV) Data source: ABS Consumer Price Index, Australia (monthly)
An ongoing challenge for housing is the cost of adding new supply. Input prices to house construction in Sydney, the series shown below, rose around +2.3% in the June quarter 2026 to be up about +3.5% over the year. The quarterly increase is larger than the four preceding quarters combined, so the moderation reported in the June update has not continued. The August NAB survey points the same way, reporting purchase-cost growth about a percentage point above its pre-conflict pace nationally and the largest industry increase in construction, up 1.2 percentage points in the month. A single quarterly print can be revised.
Download the data behind this chart (CSV) Data source: ABS Producer Price Indexes, Australia
Hunter
Employment
Employment in the Hunter (see below and footnotes for region definitions) has continued a modest upward trend. The figures here are three-month moving averages of the ABS modelled SA4 estimates, which are volatile month to month; each change below is therefore a movement in that average rather than a count of jobs created in the period. Using that measure, Hunter employment reached around 372,000 in July 2026. The average rose by about 2,000 from the month before, 2,200 over three months, 5,900 over six months and around 6,900 added over the past year (about +1.9%). This points to an underlying trajectory of gradual growth, albeit with month-to-month volatility. Over the same year, NSW employment grew by around 75,900 (about +1.7%), so the Hunter has broadly kept pace with the state in percentage terms.
Note that for the Hunter, employment statistics are modelled and reported at the Statistical Area Level 4 (SA4), including the SA4s of ‘Hunter Valley excluding Newcastle’, and ‘Newcastle and Lake Macquarie’, but excluding the Mid-Coast LGA which is classified in the Mid North Coast SA4 region. Hence data for the Hunter Region in this section excludes the Mid-Coast LGA.
A note on the source: the ABS ceased the Labour Force, Australia, Detailed publication with its March 2026 issue as part of Labour Force Modernisation. The modelled SA4 series used here now comes from table MLF1 of the main Labour Force, Australia release, which is the direct successor to the former MRM2 table and is constructed on the same basis.
Download the data behind this chart (CSV)
Data source: ABS Labour Force, Australia (table MLF1, modelled SA4 estimates)
Unemployment
Download the data behind this chart (CSV)
Data source: ABS Labour Force, Australia (table MLF1, modelled SA4 estimates)
Labour market conditions in the Hunter loosened through the first half of 2026 and have since tightened again, broadly in line with NSW. The unemployment rate rose over the first five months of 2026 to a peak of around 4.7% in May, and has since eased to 4.2%, similar to the NSW rate of 4.1% and close to its level a year earlier. Youth unemployment (15-24) in the Hunter followed the same pattern, peaking near 11.0% in May before easing to 9.7%, in line with the NSW rate of 9.7%. For national context, the Reserve Bank has discussed a ‘non-accelerating inflation rate of unemployment’, or NAIRU, of around 4.5%. That estimate is national, unobservable and revised over time, and the Bank cautions against reducing full employment to a single statistic, so it is not a threshold for the Hunter and is offered only as a reference point. Note that the values expressed here use a 3-month moving average.
Data source: ABS Labour Force, Australia (table MLF1, modelled SA4 estimates)
Employment - Vacancies
Industry-level (SA4) employment reporting for the regions remains on pause at the ABS - the latest detailed industry cut for the Hunter is only current to August 2025. In the interim, we draw on the Internet Vacancy Index (IVI) published by Jobs and Skills Australia, which tracks online job advertisements and gives a more timely read on labour demand in the region - currently to July 2026. The two views below show how vacancies in the Hunter are tracking relative to NSW and peer regions, and where demand for labour is growing or easing by profession. Data from Jobs and Skills Australia is for the “Newcastle and Hunter” region, which corresponds to the two Hunter SA4s of ‘Hunter Valley excluding Newcastle’ and ‘Newcastle and Lake Macquarie’, but excludes the Mid-Coast LGA which is classified in the Mid North Coast SA4 region.
The chart below indexes online job vacancies for each region to 100 at January 2020. At July 2026 Hunter vacancies were 61% above their January 2020 level, compared with Sydney back at its own baseline and Australia 37% above; the Illawarra was 85% above. Each region is measured against its own baseline, so these lines compare growth since 2020 rather than vacancy levels. The Hunter index has fallen from around 173 a year earlier, so that growth is now unwinding.
Download the data behind this chart (CSV)
The next chart shows the change in vacancies by occupation over the most recent 12 months. Every major occupation group except Managers (+12) recorded fewer vacancies over the year, with the largest falls in Technicians and Trades Workers (-91), Clerical and Administrative Workers (-84) and Professionals (-73). Professionals remain the largest single source of advertised demand in the region. Machinery Operators and Drivers, which includes several occupations important to mining and freight activity, record the smallest number of vacancies of any group at around 290, and a further decline over the year. The occupation group is not a proxy for the mining industry: it also spans transport, logistics, construction and manufacturing. The IVI counts online advertisements only, so it does not capture recruitment through labour hire, internal appointments or word of mouth, all of which matter in the resources sector (IVI methodology).
Download the data behind this chart (CSV)
Data source: Jobs and Skills Australia, Internet Vacancy Index
Dwelling sale prices
Download the data behind this chart (CSV)
Data source: NSW Govt Rent and Sales Report
Official DCJ sales data show that dwelling prices increased strongly through the March quarter 2026. The figures below are for the Newcastle Statistical Subdivision (SSD), DCJ’s own aggregate of Cessnock, Lake Macquarie, Maitland, Newcastle and Port Stephens, and cover all dwelling types, strata and non-strata together, so they are a dwelling sale-price measure rather than a house-price one. The SSD median reached $920,000 in the March quarter 2026, +2.9% over the quarter and +12.2% over the year. Non-strata dwellings, the closest available measure of houses, had a median of $968,000, +13.3% over the year. Sales data are published a quarter behind the rent data, so these figures describe the market to March 2026 rather than current conditions. Over the same year Greater Sydney rose 9.8% and New South Wales as a whole 7.2%. The LGA figures that follow, and the charts below, are per-LGA medians for all dwelling types. Over the six months to March 2026, the largest increases among the core five were in Cessnock (11.4%), Port Stephens (8.5%) and Lake Macquarie (7.6%), followed by Maitland (7.4%) and Newcastle (3.7%). Gains were widespread outside the core five as well, led by Dungog (25.7%), Upper Hunter Shire (16.2%) and Singleton (10.7%). Newcastle was the one core LGA to dip over the quarter itself (-1.0%), though it remains 10.2% higher over the year. Even with recent gains, several Hunter LGAs remain below the NSW median value level.
Download the data behind this chart (CSV)
Data source: NSW Govt Rent and Sales Report
Rental prices
For renters, the latest quarterly data (June 2026) indicates that rents are still edging higher, but the quarterly pace has slowed markedly. The data below tracks median weekly rent for 3-bedroom stand-alone houses. Users can view either the median value by LGA, or each LGA indexed to September 2010 (showing relative rent growth before and after that point). The latest release from the NSW Govt Rent and Sales Report extends to the June quarter of 2026. Across the Newcastle SSD (Cessnock, Lake Macquarie, Maitland, Newcastle and Port Stephens), the median rent for a three-bedroom house was $670 per week, +0.0% over the quarter and +5.5% over the year. That is the weakest quarterly result since June 2025, when rents were also flat. Quarterly rent growth in this series is volatile, and the annual rate remains above headline inflation.
Download the data behind this chart (CSV)
Data source: NSW Govt Rent and Sales Report. Data indexed to September 2010.
In the six months to June 2026, rent movements were positive across every Hunter LGA, but the increases were smaller and more tightly clustered than in the previous half-year. The strongest gains were in Muswellbrook (+8.0%) and Port Stephens (+5.7%), followed by Dungog (+3.8%), Mid-Coast (+3.6%) and Upper Hunter Shire (+3.6%). Newcastle rose 2.7% and Cessnock 1.8%, while Singleton (+1.6%), Maitland (+1.6%) and Lake Macquarie (+0.7%) were close to flat. Over the full year, increases were led by Upper Hunter Shire (+12.9%), Dungog (+10.0%), Singleton (+9.6%) and Port Stephens (+9.3%).
Download the data behind this chart (CSV)
Data source: NSW Govt Rent and Sales Report
Median price-to-rent indicator
The median price-to-rent indicator has continued to edge higher. It divides the median non-strata sale price by the median annual rent for a three-bedroom house, so that both sides refer to comparable stock. Measured to the same quarter, the March quarter 2026, Newcastle SSD non-strata prices rose +13.3% over the year against rent growth of 6.3%. A rising ratio indicates that purchase prices are high relative to rents. The peak in prices observed in 2022 is mirrored in the indicator, highlighting that rents did not experience the same surge as prices at that time. Two cautions: the properties sold are not the properties rented, so this is a relationship between two separate medians rather than a gross rental yield on any actual dwelling; and it is calculated on the NSW data cited here, so it supports no comparison with Australia as a whole.
Download the data behind this chart (CSV) Data source: NSW Govt Rent and Sales Report
Building approvals
Despite the acknowledged need for a significant increase in housing stock, there is still a lag in building approvals coming through (see figure below). The 2026 column covers January to July only, seven months, so it is not comparable with the full years beside it. Rather than annualise a part-year, which is unreliable for lumpy apartment approvals, the comparisons here are like-for-like: January to July 2026 against the same seven months of 2025, and the twelve months to July 2026 against the twelve before it. House approvals, the dominant type of building in the region, declined from a peak of around 4,600 homes in 2021 to around 3,100 in 2025, but have since turned up: 2,269 houses were approved between January and July 2026 against 1,810 in the same months of 2025, and 3,566 over the twelve months to July 2026 against 3,029 over the prior twelve, a rise of about 18%. Apartments are moving the other way, down to 291 for January to July 2026 from 502 a year earlier, and 511 over the twelve months to July against 705 over the prior twelve, a fall of about 28%. Semi-detached, row and terrace houses and townhouses are flat, at 1,654 over the twelve months to July 2026 against 1,653 over the prior twelve. Separately, the Committee for the Hunter has called for funding to enable 40,000 new homes for the region, a multi-year enabling-infrastructure proposal rather than an annual approvals target. This data is available at Statistical Area Level 2 (SA2), and thus the data presented here includes SA2 areas in the Mid-Coast LGA (see comment in footnotes).
Download the data behind this chart (CSV) Data source: ABS Building Approvals
The geographic spread of building approvals is reflected in the charts below. The figure shows the cumulative number of building approvals by type since 2016 for the whole of the Hunter. For housing, the dominance of approvals in the outer-middle regions of the Hunter is evident, with house approvals concentrated in the Branxton, Thornton and Morisset areas. The urban areas in Newcastle and Lake Macquarie see a concentration of apartment approvals, with few new house approvals. Mid-density housing (semi-detached, row and terrace houses) is spread over a combination of urban areas and the outer SA2s.
Houses
Apartments
Semi-detached
Download the data behind this chart (CSV)
The Institute for Regional Futures explored the issues surrounding housing in the region at Hunter Insight Series: Building a Healthy Housing Market.
Greenhouse gas emissions
As Australia transitions to a net-zero economy, there will be significant changes for the Hunter region. The dashboard includes the latest available data on emissions, and will incorporate energy statistics to reflect this transition. Local-scale GHG emissions are published with a lag of around three years. The NSW Government released its 2016 to 2023 estimates in July 2026, and this section has been updated to that release. All years are financial years: “2023” means the year ending June 2023. Headline totals exclude land use, land-use change and forestry, because this sector contains substantial and volatile net removals; the chart below shows it as its own net bar so the exclusion is visible.
In the year to June 2023, 44.6 Mt or 34.5% of NSW emissions were in the Hunter, down from 48.4 Mt and 37.1% in 2021. The region has 9.6% of the NSW population. Sixty-seven percent of Hunter emissions are due to electricity generation. An estimated 65% of the region’s electricity-generation emissions were associated with electricity exported to consumers outside the Hunter, where they are counted as scope 2 emissions. Excluding them leaves 25.4 Mt of emissions in the Hunter, still 19.6% of the state’s emissions.
On a per-capita basis, emissions in the Hunter are 55.8 t/capita, and, after adjusting for exported electricity to other users outside the region, 31.7 t/capita. NSW as a whole is 15.5 t/capita on the same basis, in the same year and from the same dataset. A comparison with the national inventory is not made here: it is compiled on a territorial basis and treats land use differently, so it is not like-for-like with a regional estimate that carries generation for export.
Progress in emissions reduction is being observed, particularly as some of the ageing coal-fired power stations in the region are either being retired or reducing their capacity utilisation. Hunter emissions in the year to June 2023 were about 5.7% lower than the year before and about 7.8% below 2021, primarily due to changes in electricity generation, with a notable decline in fugitive emissions from fuels as well.
Download the data behind this chart (CSV)
Data source: NSW Net Zero Emissions Dashboard
A more detailed view of emissions by sector is provided below. In this view, for electricity, so-called “scope 2” accounting is used, where emissions due to electricity generation are assigned to the electricity customer (and thus emissions due to electricity exported from the region are not included).
Download the data behind this chart (CSV)
Data source: NSW Net Zero Emissions Dashboard
Scope 3 GHG Emissions: Scope 3 covers other indirect upstream and downstream value-chain emissions, excluding the scope 2 emissions of purchased energy. This accounting of emissions provides a background to additional opportunities to decarbonise for industry, yet are often difficult to realise because of measurement issues and the need to involve multiple stakeholders. The Scope 3 emissions of industrial production in the Hunter have been estimated based on a unique combination of data from the EXIOBASE global MRIO model, national IO tables and local IO data from REMPLAN. The boundary is industrial production located in the Hunter, and the estimates exclude scope 1 and scope 2 emissions.
The chart below shows greenhouse gas emissions by aggregated source and destination sectors in the Hunter region. Emission sources are broken down by sector and colour: agriculture, forestry and fishing; mining; manufacturing; electricity and other utilities; construction; services; and transport. Further detail is available upon request, with emissions broken down into supply chains. The scope 3 emissions shown below exclude scope 1 and scope 2 emissions.
Manufacturing is the largest contributor to Scope 3 emissions in the region. The manufacturing sector’s Scope 3 emissions are close to 15 Mt of CO2-equivalent (CO2-e). Aggregate emissions are visible in the chart below, but due to the broad nature of the sector, these emissions are spread over many sources. Some key contributors to the results are scope 3 emissions from mining sources and from indirect electricity use due to non-ferrous metal manufacturing; agricultural emissions from meat product manufacturing; and emissions from cement and lime preparation for concrete manufacturing. The IRF provides insight into organisational scope 3 emissions in the region. Contact us below for more information.
For more detail on the Hunter Insight Dashboard please contact the Institute for Regional Futures
* The data presented here for the Hunter region includes the local government areas (LGAs) of Cessnock, Dungog, Lake Macquarie, Maitland, Mid-Coast, Muswellbrook, Newcastle, Port Stephens, Singleton and Upper Hunter. However, the ABS collects and reports data by Statistical Area which does not fully align with this definition. The Statistical Area Level 4 (SA4) classification, commonly used for reporting economic statistics, includes the above LGAs in two SA4 areas comprising the Hunter Valley region but classifies the Mid-Coast LGA in the Mid North Coast SA4. At the Statistical Area Level 2 (SA2), the SA2 areas that are part of the Mid-Coast LGA (including Taree, Gloucester, Old Bar, Bulahdelah, Forster, Tuncurry) are included in the data presented for the Hunter. The building approval data is available at SA2 level. For housing rental and sales data, the NSW Govt Rent and Sales Report provides aggregate median values only for the Greater Newcastle area based on old statistical subdivisions, but which corresponds to the LGAs of Cessnock, Lake Macquarie, Maitland, Newcastle and Port Stephens.
Suggested citation: Institute for Regional Futures. “Hunter Insight Dashboard, Economic Update – September 2026.” University of Newcastle. September 2026. https://www.newcastle.edu.au/research/centre/regional-futures/hunter-insight-dashboard.
© The University of Newcastle 2026. Apart from any use as permitted under the Copyright Act no part may be reproduced by any process without the permission of the publishers.
Disclaimer: The information contained herein is believed to be reliable and accurate. However, no guarantee is given as to its accuracy or reliability, and no responsibility or liability for any information, opinions, or commentary contained herein, or for any consequences of its use, will be accepted by the University, or by any person involved in the preparation of this report.
The University of Newcastle acknowledges the traditional custodians of the lands within our footprint areas: Awabakal, Darkinjung, Biripai, Worimi, Wonnarua, and Eora Nations. We also pay respect to the wisdom of our Elders past and present.