On March 17, 2021, the skies above eastern New South Wales put on a spectacular show. Thunder rumbled like the Western Front, as spectacular bursts of purple lightning lit up a landscape otherwise cloaked in darkness from the unrelenting rainclouds.
For the following week the rain came down, drenching the state. The Mid North Coast of NSW was hit especially hard, the Bureau of Meteorology noting that numerous areas experienced more than 600 mm of rain in just four days – the village of Comboyne being of particular note, lashed with 853 mm from 19 to 22 March.
To put that in perspective, Comboyne’s average annual rainfall is 1573 mm, meaning more than half a year’s worth of precipitation came down in those four sodden days.
The result was flooding that the Premier at the time described as being a “one-in-100-year event”, seeing towns evacuated, roads and airports closed, and a house near Taree literally washed away on the rising waters of the Manning River.
Meanwhile, overhead, in the freezing silence of space, the Gravity Recovery and Climate Experiment Follow-On (GRACE-FO) mission watched on.
Unfathomable accuracy at breath-taking velocity
Rather than a solitary spacecraft, GRACE-FO (a joint mission between NASA and the German Research Centre for Geosciences) is comprised of a pair of near-identical satellites, orbiting the Earth in constant communication with one another through microwave ranging instruments and lasers, separated by an average distance of around 220 km.
It’s critical to note, however, that this average distance – “around 220 km” – is given to aide in human comprehension. The satellites themselves can measure their varying gap to within one micron, a distance NASA describes as being “about the diameter of a blood cell”.
It’s a level of accuracy that’s only made more jaw-dropping when you learn that GRACE-FO is travelling at a velocity of more than 27,000 km per hour.
To try put that all in perspective, it’s something akin to measuring the distance from a single fibre of timber in the foyer of the University’s Great Hall to the precise centre of the bullseye on the dartboard at Comboyne Ex-Servicemen’s & Citizens Club – a level of accuracy that would require a microscope – all while travelling at almost 22 times faster than the speed of sound.
Some 490 km below this piece of out-of-this-world engineering, in a quiet office in the Engineering precinct at Callaghan campus, Professor Shin-Chan Han pored over the data beamed down from GRACE-FO.
It’s what’s beneath your feet, not what falls on your head, that counts
A long-time member of the original GRACE mission – the FO suffix in the present mission effectively indicates it’s the sequel to a pair of satellites that were decommissioned in 2017 – Professor Han is one of the world’s foremost experts on why the instruments aboard the spacecraft are so precise and what the slightest deviation in distance between the two means.
Those who remember their high-school maths may recall gravity on Earth being measured at approximately 9.807 metres per second squared, however that is the average value.
“Gravity actually varies across the surface of the Earth based on the mass present,” Professor Han explains.
“The satellites’ microwaves and lasers measuring the distance between themselves are affected by gravity, which is an indication of mass.”
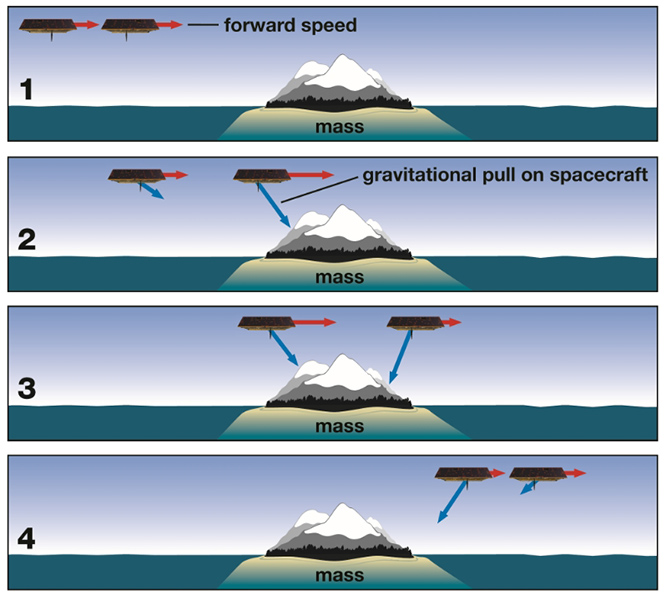 NASA explains the variations using the example of the satellites passing over a mountain range:
“As the lead satellite approaches a region with high mass, such as a mountain range, the higher gravitational pull tugs the satellite a little farther ahead of the following satellite. Moments later, the following satellite is pulled forward in its turn, shortening the distance between them. When the lead satellite moves past the mountains, their high mass drags at it from behind, again narrowing the gap between the two satellites.”
But given the aforementioned precision of the instruments on board, far more dynamic variations in mass, and therefore gravity, can be measured.
Such as water.
“We look at the data and we can infer how much water is moving on the Earth’s surface,” Professor Han explains.
And this is where the data beaming down from hundreds of kilometres above the gathering storm clouds becomes so critical.
Because a $9 water gauge at the hardware store can gather accurate data on how much rain is coming down, but that’s only telling part of the story when it comes to floods.
What’s arguably more critical is the water already present in the ground.
60 trillion litres of water… Twice!
While it was not quite as spectacular nor sudden, February 2020 was a soaking wet month on the east coast of Australia as well, with a similar amount of rainfall as that of March 2021.
But there was no mass-flooding event in the early months of 2020.
As for why 2021 gave us conditions akin to a Roland Emmerich film, while the preceding year was more Singin’ in the Rain, that would be due to the amount of water to be found beneath our feet, rather than falling on our heads.
Few will ever forget the 2019–20 Australian bushfire season, our skies tinged yellow, ash washing up on our coastline and air quality dropping to hazardous levels, as more than 17 million hectares burned across the country, destroying thousands of homes and killing or displacing more than three billion animals.
The February rains were obviously welcome respite that helped to quell the raging infernos, but they also served to replenish soil moisture storage, which had fallen to a record minimum by the summer of 2019-20.
The mercifully wet February 2020 saw some 60 trillion litres of water serve to seriously recharge dry soils, returning them to levels that had not been recorded since 2017.
These soil moisture levels climbed slightly higher throughout the wet months of 2020, before dropping off during the summer of 2020-21 – although the latter drop-off was nowhere near the record bottom-out of the previous summer.
All of which meant that by the time the rains of March 2021 came around, with that one particularly hectic week adding an estimated 60-70 trillion litres of water storage, the soil moisture levels were relatively high.
So, rather than finding a home in the parched earth as it had in 2020, the rain that fell in 2021 generated significantly more runoff.
“This is likely the reason for extensive flooding in 2021 compared to 2020,” Professor Han concluded in a paper he and his colleagues authored for Earth and Space Science.
“These two contrasting consequences from the similar rainfalls are excellent examples of demonstrating how antecedent soil moisture condition governs runoff and flooding… this is important to implement into flood forecasting and warning practices.”
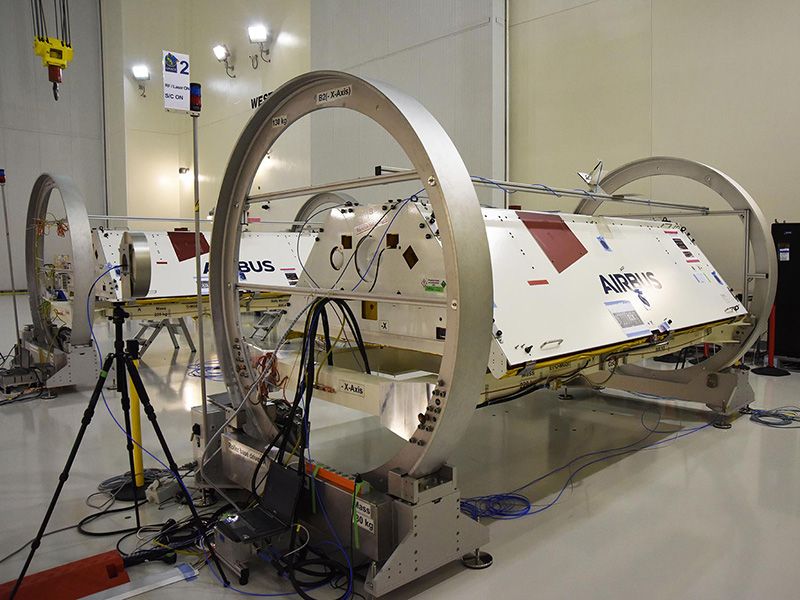
GRACE-FO satellites in the lab (USAF)
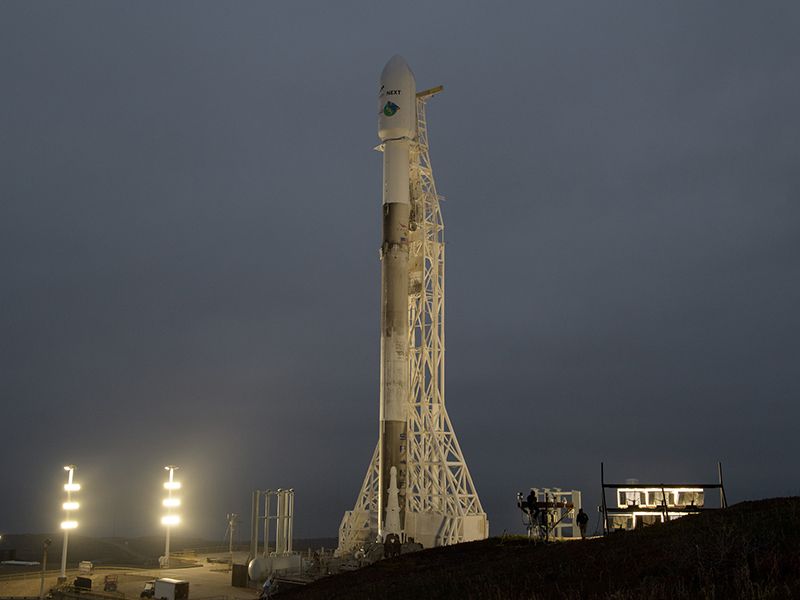
A SpaceX Falcon 9 rocket with the GRACE-FO onboard (Photo Credit: NASA/Bill Ingalls)
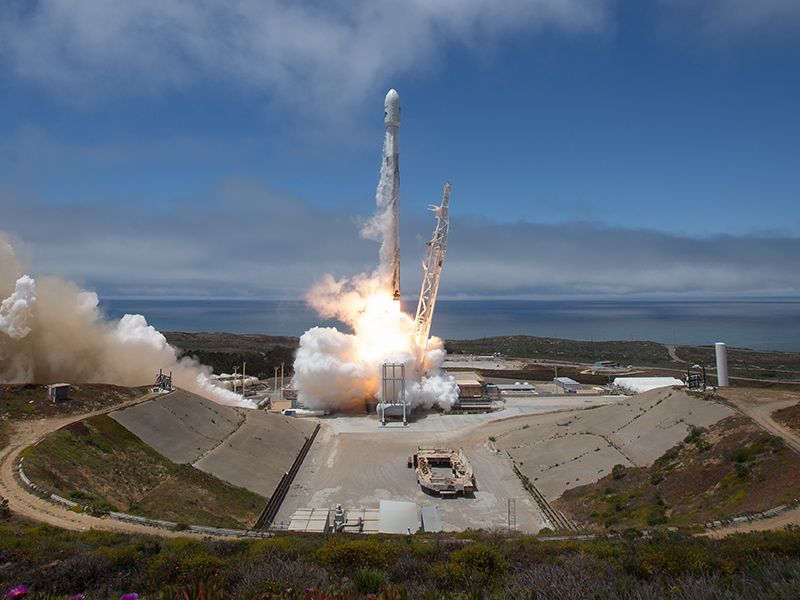
GRACE Follow-On spacecraft launches (NASA/Bill Ingalls)
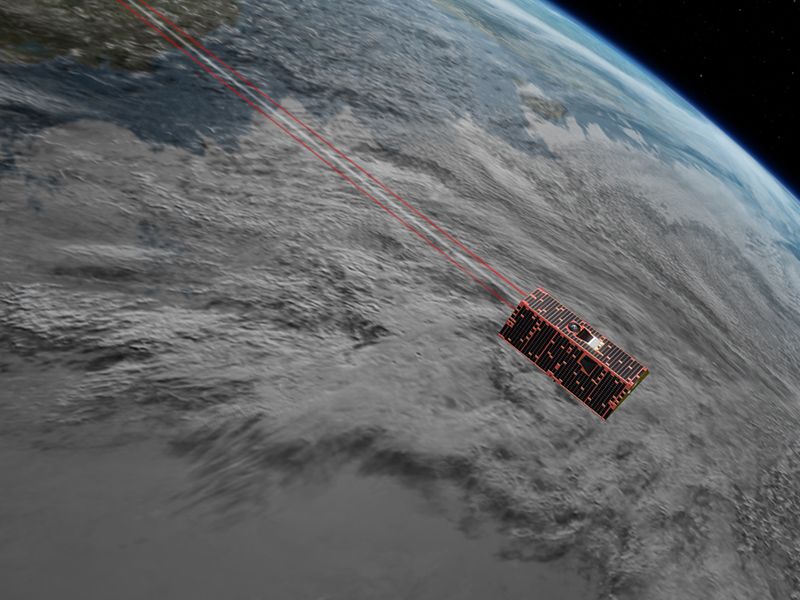
Illustration of GRACE-FO above Alaska (Courtesy NASA/JPL-Caltech)
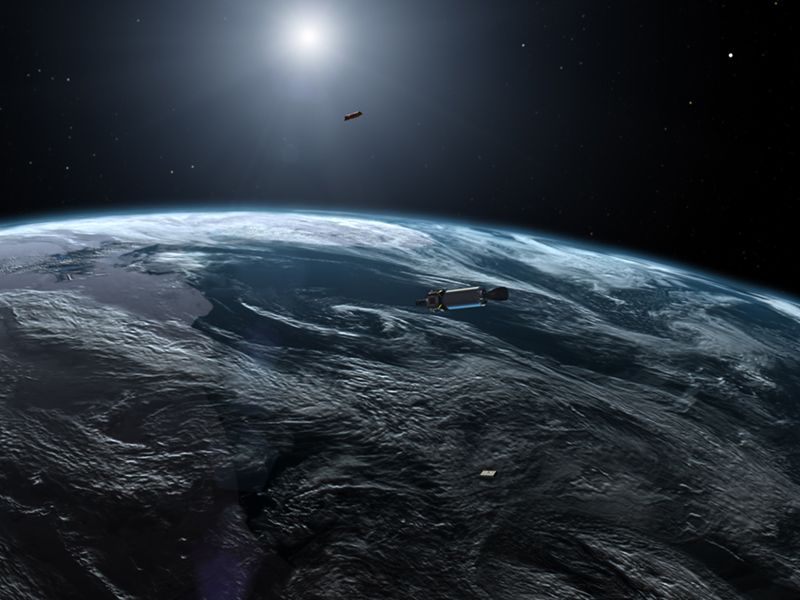
Illustration of GRACE-FO above Antarctica (Courtesy NASA/JPL-Caltech)
A better way to use GRACE-FO in the future?
As you’ve no doubt worked out by now, Professor Han is getting his data for soil moisture from the GRACE-FO mission, which is “tracking Earth's water movement to monitor changes in underground water storage, the amount of water in large lakes and rivers, soil moisture, ice sheets and glaciers, and sea level caused by the addition of water to the ocean.”
Tracking water movement across the entire planet is an extremely broad remit, which means that even though the science, maths and technology used are industry-leading, there are drawbacks.
For example, the official data that NASA releases are monthly ‘snapshots’.
“The change of ice-mass loss in Greenland and Antarctica is a slow process, so can be mapped properly using monthly data,” Professor Han says.
“However processes like flooding cannot be mapped using monthly processes.”

The obvious illustration of the drawbacks in using monthly data were on full display during March 2021, when NASA’s data showed the month had similar rainfall to February 2020. While that was true, a single week in March ’21 saw the vast majority of the month’s precipitation fall, which paints a substantially different picture – the same rainfall spread out over four weeks may not have seen a house become a river barge.
So Professor Han and his colleagues have set about using a different data set to quantify water storage – one that puts to use the insanely accurate instruments that are onboard the twin satellites measuring the slightest shift in the distance between them.
“Most of the other teams are looking at NASA’s official monthly snapshot. But we are looking at the satellite-to-satellite perturbation directly,” Professor Han explains.
“So different days have different perturbations and we are measuring the changes of the satellite-to-satellite motions during the month, allowing us to quantify changes from the original data of satellite perturbation.
“This is one way we can track processing like flooding with a timeframe of less than a month.”
Using this approach – which the team also used to accurately measure the 2020 monsoon season in Bangladesh, publishing their results in the prestigious Proceedings of the National Academy of Sciences of the United States of America – has a latency of just one to three days, rather than the number of months that it can take for NASA’s official snapshot to be published.
It’s a method the team believe can be used for other applications around the planet, giving an accurate and up-to-date picture of water storage levels.
The hope is that in the coming years, this method will be honed and receive broad take up, leading to faster and more accurate forecasts of flooding the world over.
In the meantime, with La Niña announced by the Bureau of Meteorology, leading to a prediction of “above average rainfall across much of northern and eastern Australia during summer”, it’s worth keeping in mind that the wet months ahead could continue to have repercussions long after the heavy rains have fallen.