Birkeland currents from iridium
A sample of the low-data rate processed magnetic field data from the Iridium satellites is shown in Figure 1. The red lines show the cross track component of the magnetic field caused by the Birkeland currents. The black arrows show the reconstructed magnetic field (using a bit of mathematics).
Using the electromagnetic equation of Ampere and the magnetic data, we can reconstruct the Birkeland currents. This is shown in Figure 2.
The current pattern is shown over the northern hemisphere for 23 November, 1999. There are typically two current systems, known as region 1 and region 2 (space physicists are very creative). The region 1 currents are poleward of the region 2 currents.
All plots are shown in polar coordinates, viewed from above the north geomagnetic pole. Noon is toward the top, midnight at the bottom with dawn on the right and dusk on the left. Poleward latitudes map further out into space compared with the more equatorward latitudes. The region 1 current on the dawn side (right) is the blue semi-ring located near 70 degrees and flows downward toward the Earth while the dawnside region 2 current is the red ring equatorward near 65 degrees and flows up out of the ionosphere. On the dusk side the region 1 current is red (radially outward) while the region 2 current is now blue as it flows in toward the Earth here.
Typical values for the peak currents are around 1 uA per square metre. Over the whole current system, this adds up to around 7 million Amps in total.
Statistics of the Birkeland current patterns over the northern hemisphere show a direct correlation with interplanetary magnetic field quantities. The statistical patterns of current flowing into and out of the northern hemisphere ionosphere over the summer months is shown.
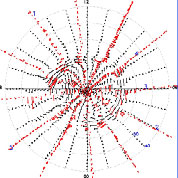 Figure 1 | 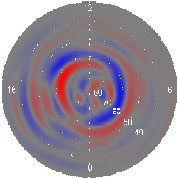 Figure 2 |
Contact us

Enquiries
-
Dr Hannah Schunker
Phone: +61 (02) 405 53484
hannah.schunker@newcastle.edu.au
The University of Newcastle acknowledges the traditional custodians of the lands within our footprint areas: Awabakal, Darkinjung, Biripai, Worimi, Wonnarua, and Eora Nations. We also pay respect to the wisdom of our Elders past and present.